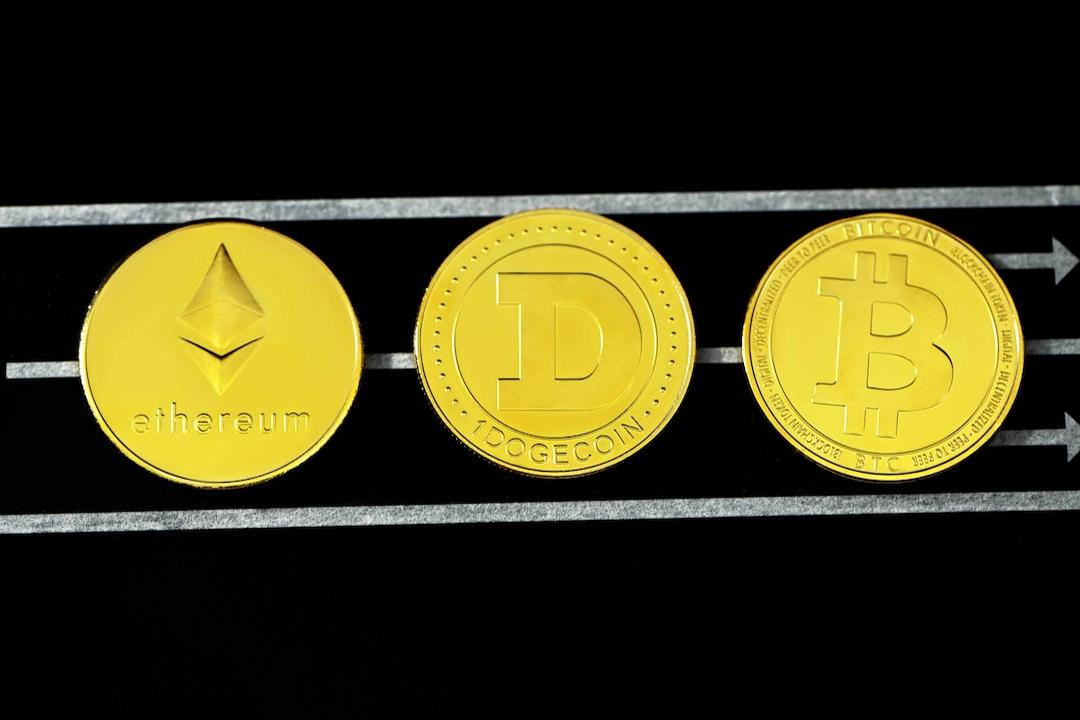
Bitcoin’s price surged after the release of the United States Consumer Price Index (CPI) data, which came in lower than expected. The CPI numbers remained unchanged from the previous month, with a year-on-year figure of 3.3%, showing a slight decline from the forecasted 3.4%.
The strong recovery from the $66,000 level indicates that bullish investors are still active and are buying at key support levels. Traders are anticipating the next move to be either above $73,777 or below $56,552, with the possibility of continued range-bound trading until then.
Japanese company Metaplanet has been leveraging Bitcoin’s sideways movement to bolster its treasury. The firm recently announced the acquisition of 23.25 Bitcoin, bringing their total holdings to 141.07 Bitcoin at an average price of $65,365.
The question remains whether buyers can sustain the upward momentum in Bitcoin and other alternative cryptocurrencies. To gain insights, let’s examine the charts of the top 10 cryptocurrencies.
Bitcoin Price Analysis
Bitcoin dipped below the 20-day exponential moving average ($68,700) but found support at the 50-day simple moving average ($65,982). Bulls stepped in to push the price above the 20-day EMA, suggesting that the BTC/USDT pair may consolidate within the range of $66,500 to $72,000 for a while.
To take control, buyers will need to surpass the resistance zone of $72,000 to $73,777, paving the way for a potential rally towards $80,000 and ultimately $88,000. Conversely, a drop below the 50-day SMA could trigger a downward move towards $60,000.
Ether Price Analysis
Ether failed to break above $3,730, leading to a downward move below the 20-day EMA ($3,655). However, strong buying near the 50-day SMA ($3,388) suggests that buyers are keen on lower levels. A successful breach of $3,730 could propel the ETH/USDT pair to $3,887 and subsequently to $3,977.
On the downside, a rejection at $3,730 might signal bearish pressure, potentially pushing the pair towards the 50-day SMA support. A breakdown below this level could lead to a drop towards $2,850.
BNB Price Analysis
BNB dropped below the 50-day SMA ($605) but found support, indicating buying interest on dips. Bulls are now aiming to surpass the $635 resistance level, signaling a possible end to the correction. If successful, the BNB/USDT pair could target $722.
However, a rejection at the overhead resistance followed by a break below $591 would indicate selling pressure. Minor support at $560 may come into play, but a breakdown could lead to a drop towards $536.
Solana Price Analysis
Solana broke below the 50-day SMA ($157) but swiftly rebounded from the channel’s support line. Bulls will seek to break above the resistance line, potentially leading to a move towards $176 and $189.
A sharp downturn from the 20-day EMA or the resistance line could pave the way for a drop to $116, negating the optimistic scenario.
XRP Price Analysis
XRP failed to capitalize on the bounce from the crucial support at $0.46, indicating weak demand at higher levels. The moving averages are turning downwards, suggesting bearish control.
A turnaround from the moving averages could prompt bears to push the XRP/USDT pair below $0.46. However, a breakout above the moving averages could extend consolidation between $0.46 and $0.57.
Dogecoin Price Analysis
Dogecoin bounced sharply from $0.13, signaling bullish interest at lower levels. Moving averages may act as a significant barrier, with a failure to breach leading to a potential drop towards $0.12.
A breakout above the moving averages could extend range-bound trading between $0.12 and $0.18, with a bullish scenario unfolding above $0.18.
Toncoin Price Analysis
Toncoin faced downward pressure on June 11 but managed to hold above the uptrend line. The 20-day EMA and positive RSI suggest bullish control, with buyers eyeing the $7.67 resistance level.
A successful breach could propel the TON/USDT pair towards $10, while a rejection may signal bearish activity, potentially pushing the pair below the uptrend line to $6.
Shiba Inu Price Analysis
Shiba Inu has been consolidating between $0.000020 and $0.000030, with buyers stepping in on dips and sellers on rallies. A break below $0.000020 could trigger further downside towards $0.000017.
Conversely, a breakout above the moving averages could prolong range-bound trading, with a breakthrough at $0.000030 favoring the bulls.
Cardano Price Analysis
Cardano faced resistance at the triangle’s support line, hinting at bearish sentiment. Buyers are targeting a move above the moving averages to negate the breakdown, potentially pushing the ADA/USDT pair towards the resistance line.
A rejection at the moving averages could lead to further downside, with bears aiming for $0.35.
Avalanche Price Analysis
Avalanche has been oscillating between $29 and $40, with traders buying near support and selling at resistance levels. A potential relief rally from $30.59 may face resistance at the moving averages.
A downturn from the moving averages could prompt bears to push the AVAX/USDT pair below $29, opening the door for a drop towards $20.
This article serves as information and does not offer investment advice. Readers are encouraged to conduct their own research before making any financial decisions.

